PRS statistics
How does this work?
Click the question mark and we’ll guide you through this tool in a couple of steps.

Pick a date
You can choose between a weekly, monthly and yearly report and pick a time frame depending on your choice.

Watch the graphs
The graphs for PRS movements (selected by default) show you a summary for the selected time frame, the number of departures and arrivals per runway (PRS and no PRS), and the frequency the various runway configurations were active (i.e. one/multiple runway(s) in use at the same time). The last graph allows you to compare the data with the surrounding periods of time. Hover over all graphs to see additional info. For these statistics, skeyes data is used. Military and helicopter flights are excluded from the figures.

Movements or time?
By switching from PRS movements to PRS time at the top of the page, you can see the PRS time (rather than PRS movements) statistics. These statistics show how frequently the applicable PRS configuration was used. PRS movements are the number of movements (departures and arrivals) that took place on one of the runways specified in the applicable PRS configuration. PRS time shows how frequently the applicable PRS configuration was used.
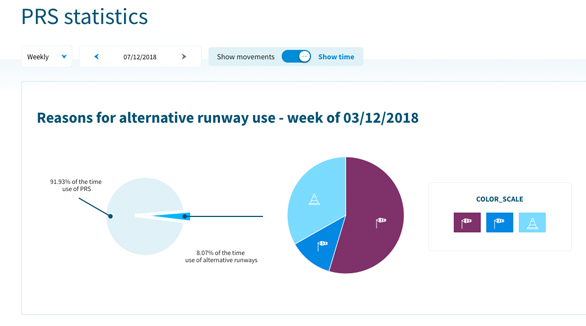
Show PRS movementsShow PRS time
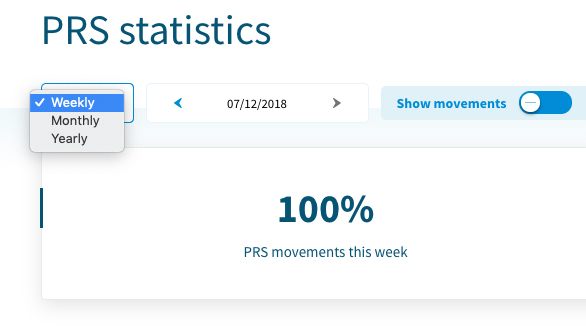
5%
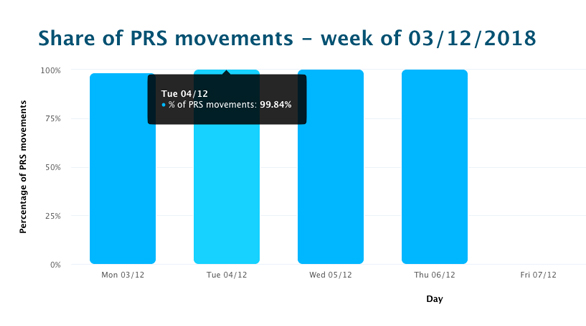
PRS movements this week
3,502
Total movements this week
01
07L
07R
19
25L
25R